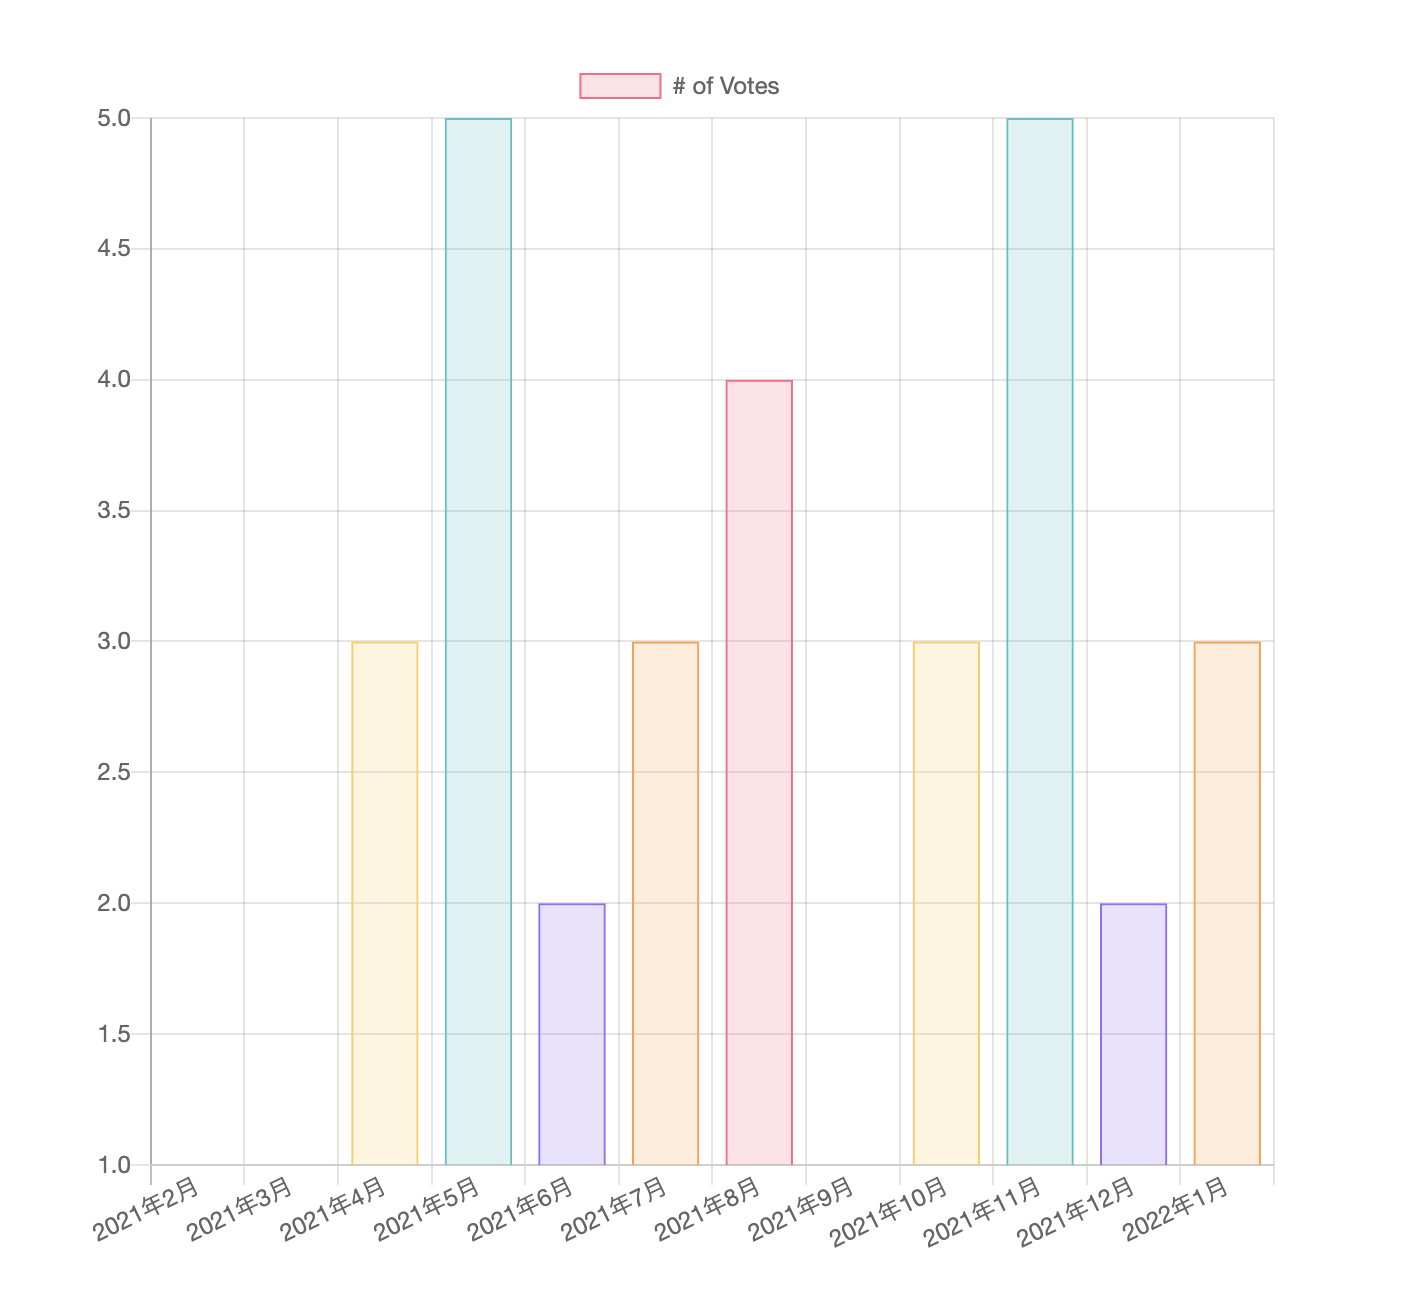
vue-chartjsを使って毎月のデータを可視化できるようにする。横軸には毎月の値を用い、縦軸はダミーの値を用いる。
注意すべきポイントとしてはVue3ではvue-chartjsは使用できない1。 またchart.jsも3系には対応していない2。
example/src/main.js
import Vue from 'vue'
import App from './App.vue'

Vue.config.productionTip = false

new Vue({
  render: h => h(App),
}).$mount('#app')
example/src/App.vue
<template>
  <div id="app">
    <div class="small">
      <Chart />
    </div>
  </div>
</template>

<script>
import Chart from './components/Chart'

export default {
  name: 'App',
  components: {
    Chart,
  }
}
</script>

<style>
  .small {
    max-width: 600px;
    margin:  150px auto;
  }
</style>
example/src/components/Chart.vue
<script>
import { Bar } from 'vue-chartjs'

export default {
  extends: Bar,
  mounted () {
    this.renderChart(
      {
        labels: [
          '2021年2月',
          '2021年3月',
          '2021年4月',
          '2021年5月',
          '2021年6月',
          '2021年7月',
          '2021年8月',
          '2021年9月',
          '2021年10月',
          '2021年11月',
          '2021年12月',
          '2022年1月',
        ],
        datasets: [{
          label: '# of Votes',
          data: [
            1,
            1,
            3,
            5,
            2,
            3,
            4,
            1,
            3,
            5,
            2,
            3,
          ],
          backgroundColor: [
            'rgba(255, 99, 132, 0.2)',
            'rgba(54, 162, 235, 0.2)',
            'rgba(255, 206, 86, 0.2)',
            'rgba(75, 192, 192, 0.2)',
            'rgba(153, 102, 255, 0.2)',
            'rgba(255, 159, 64, 0.2)',
            'rgba(255, 99, 132, 0.2)',
            'rgba(54, 162, 235, 0.2)',
            'rgba(255, 206, 86, 0.2)',
            'rgba(75, 192, 192, 0.2)',
            'rgba(153, 102, 255, 0.2)',
            'rgba(255, 159, 64, 0.2)',
          ],
          borderColor: [
            'rgba(255, 99, 132, 1)',
            'rgba(54, 162, 235, 1)',
            'rgba(255, 206, 86, 1)',
            'rgba(75, 192, 192, 1)',
            'rgba(153, 102, 255, 1)',
            'rgba(255, 159, 64, 1)',
            'rgba(255, 99, 132, 1)',
            'rgba(54, 162, 235, 1)',
            'rgba(255, 206, 86, 1)',
            'rgba(75, 192, 192, 1)',
            'rgba(153, 102, 255, 1)',
            'rgba(255, 159, 64, 1)',
          ],
          borderWidth: 1
        }]
      },
      {
      },
    )
  }
}
</script>
example/package.json
{
  "name": "example",
  "version": "0.1.0",
  "private": true,
  "scripts": {
    "serve": "vue-cli-service serve",
    "build": "vue-cli-service build",
    "lint": "vue-cli-service lint"
  },
  "dependencies": {
    "chart.js": "^2.9.4",
    "core-js": "^3.6.5",
    "vue": "^2.6.11",
    "vue-chartjs": "^3.5.1"
  },
  "devDependencies": {
    "@vue/cli-plugin-babel": "~4.5.0",
    "@vue/cli-plugin-eslint": "~5.0.8",
    "@vue/cli-service": "~5.0.8",
    "babel-eslint": "^10.1.0",
    "eslint": "^6.7.2",
    "eslint-plugin-vue": "^6.2.2",
    "vue-template-compiler": "^2.6.11"
  },
  "eslintConfig": {
    "root": true,
    "env": {
      "node": true
    },
    "extends": [
      "plugin:vue/essential",
      "eslint:recommended"
    ],
    "parserOptions": {
      "parser": "babel-eslint"
    },
    "rules": {}
  },
  "browserslist": [
    "> 1%",
    "last 2 versions",
    "not dead"
  ]
}
以下のグラフが描画される。

脚注
1
対応する時間がないようだ。また別の代替え案も提示されている。 https://github.com/apertureless/vue-chartjs/issues/699
2
Vue3のサポートと同様でこちらもissueはあるが、時間がなくて対応されていないようだ。https://github.com/apertureless/vue-chartjs/issues/695